Gantt Chart Window
The Gantt Chart Window can display two views of project Gantt charts: Standard and Probabilistic.
- Standard Gantt Chart
- Probabilistic Gantt Chart
This plots the tasks against time using the original duration of the tasks defined in the imported project. It is similar to the standard Gantt charts produced by Microsoft Project and Primavera P6.
This is a completely new view of a standard Gantt chart that plots simulation data to display the variation in durations and dates that are possible. This enables you to see the simulated project flow over time and visually understand the possible outcomes in the schedule.
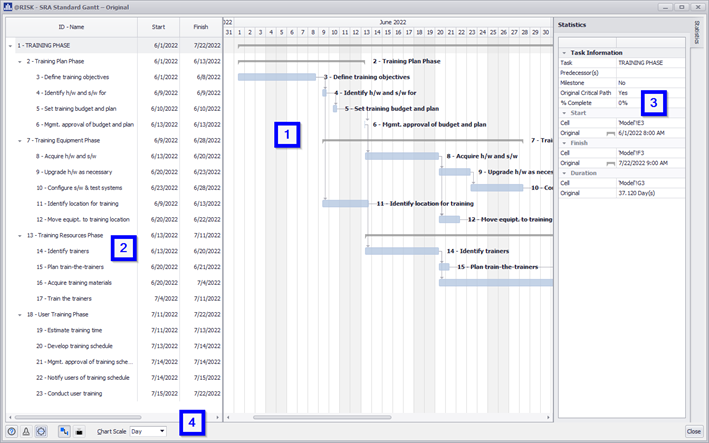
The Gantt Chart Window consist of four primary components:
- Chart Pane
- Task Pane
- Statistic Pane
- Command Buttons
Chart Pane
The Chart Pane of the Gantt Chart Window is where you define the chart view – Standard or Probabilistic, as described above. In addition, each chart view has two possible states – Original and Iteration – which depend on the calculation mode setting in @RISK.
There are two calculation modes in @RISK – Static and Random. When the Static mode is selected (which is @RISK’s default), the displayed @RISK distributions do not change with normal Excel recalculations. When the Random mode is selected, then you can press the F9 key to walk through a Monte Carlo simulation one iteration at a time, step-by-step. Each time the F9 key is pressed, the displayed @RISK distribution values, and the entire model, update to reflect the current calculated values. For more information search Random/Static Standard Recalc in the online help.
When @RISK is in Static mode, then the displayed Gantt chart will not change with standard Excel recalculations. This is known as the Original state of the Gantt chart. In the Original state, the main, thicker bars display the original tasks as defined in the imported project.
When @RISK is in Random mode, the Gantt chart updates every time F9 is pressed to reflect the current calculated schedule. This is known as the Iteration state of the Gantt chart. In the Iteration state, the main bars change to display the most current calculated values in the schedule.
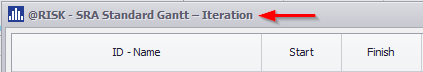
The current view and state of the Gantt Chart Window are shown in the title bar:
Standard Gantt Charts
As noted above, the Standard Gantt chart displays tasks against time as originally defined in the static imported project.
The possible states of the Standard Gantt chart are as follows:
- Original state – Only the main task bars are displayed, showing the original schedule.
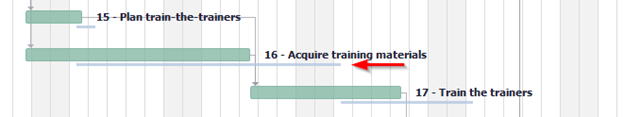
- Iteration state – The main task bars display the current recalculation of the schedule. In addition, if the Update Excel with Values from the Selected Iteration option is enabled in the @RISK Data Window, then the main bars of the chart will display the selected iteration of the last simulation run. The original schedule tasks are displayed as baselines – thinner bars below the main task bars.
Probabilistic Gantt Charts
As noted above, the Probabilistic Gantt chart displays simulation of the project over time, highlighting variation in how long tasks may take and when they will finish.
The possible states of the Probabilistic Gantt chart are as follows:
- Original state – Only the main task bars are displayed, showing the original schedule.
- Iteration state – The main task bars display the current recalculation of the schedule. In addition, if the Update Excel with Values from the Selected Iteration option is enabled in the @RISK Data Window, then the main bars of the chart will display the selected iteration of the last simulation run. The original schedule tasks are displayed as baselines – thinner bars below the main task bars.
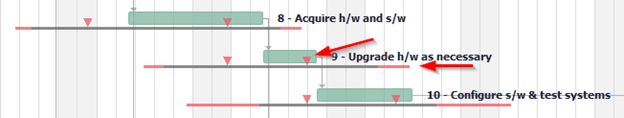
In addition, probabilistic bars are displayed below the main task bars. Each probabilistic bar consists of three segments: the entire bar, the colored tails, and midpoint triangles.
Entire Bar – The entire bar extends from the earliest Start Date to the latest Finish date, and represents the longest simulated duration for that task.
Percentile Tails – The red tails denote the lower percentile of the Start Date and the upper percentile of the Finish Date, defined by default as 5% and 95% respectively. These percentiles, and the color of the tails, can be configured through the Chart Options (for individual workbooks) in the Gantt Chart Window command buttons, or Gantt Chart Preferences (for default settings) in the main Schedule menu.
Midpoint Arrows – Red arrows mark the midpoints of the Start Date and Finish Date. These midpoints can refer or either the statistical mean or median, and are configurable through the Chart Options (for individual workbooks) in the Gantt Chart Window command buttons, or Gantt Chart Preferences (For default settings) in the main Schedule menu.
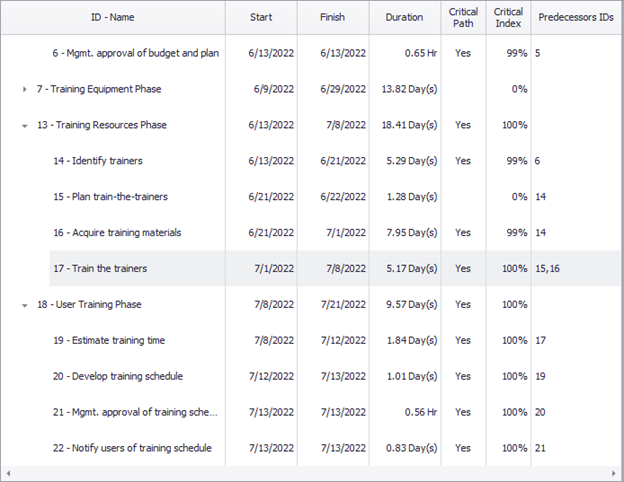
Task Pane
The left pane of the Gantt Chart Window displays a tree list containing all the tasks with the following information:
- Sequential ID of the task and its Name.
- Start Date, Finish Date and Duration of the task as presented with main task bars in the chart — for the Original Gantt chart state showing the original schedule values, or Iteration Gantt chart state showing the latest recalculated schedule values.
- Critical Path — for the Original Gantt chart state showing the original schedule values, or Iteration Gantt chart state showing the latest recalculated schedule values.
- Critical Index — for Probabilistic Gantt chart views only, as it calculates the percentage of the time the task appears on the critical path during a simulation.
- Predecessor IDs — with the relation type if it is different than Finish to Start
Any summary task can be expanded or collapsed with the triangle button next to the task ID.
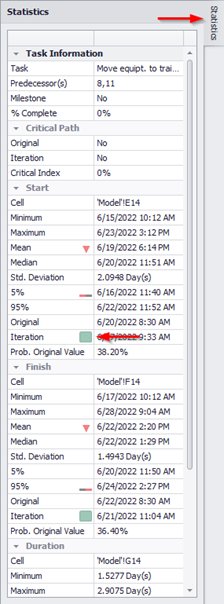
Statistics Pane
Appearing on the right side of the Gantt Chart Window, the Statistics Pane contains detailed information about a given selected individual task. For Probabilistic Gantt charts, the statistics for Start Date, Finish Date and Duration are also included.
The icons in the grid match icons that appear in Gantt chart, making it easier to identify key statistics in the schedule.
The Statistics Pane can be expanded or hidden using the button at the right edge of the window.
Command Buttons
The following command buttons appear at the bottom of the Gantt Chart Window:
 Help — Open help resources (online or local, based on @RISK Settings); see Help Button for more information
 Select Simulation # to display Only active when browsing a Probabilistic Gantt chart and simulation results include multiple simulations. Switch between simulations to display in the chart
 Settings/Actions — Window-specific setting options and commands. The Gantt Chart Window Settings/Actions are:
- Chart Options – Open the Gantt Chart Options dialog to configure chart defaults for the current workbook.
- Expand – Only available if the selected summary task in the Task Pane is collapsed. The summary task will be expanded to show its sub-tasks.
- Collapse – Only available if the selected summary task in the Task Pane is expanded. The selected summary task will be collapsed to hide its sub-tasks.
- Full Expand – Only available if there is at least one collapsed summary task in the task list. All summary tasks will be expanded to show their sub-tasks.
- Full Collapse – Only available if there is at least one expanded summary task in the task list. All summary tasks will be collapsed to hide their sub-tasks.
- Find – Open the Find dialog to search for keywords in the Task Pane.
 Standard Gantt View –Switch the chart to Standard Gantt chart view.
 Probabilistic Gantt View – Only active when there are simulation results are available for the workbook. Switch the chart to Probabilistic Gantt chart view.
 Scale Selection – Zoom in or zoom out of the Gantt chart by changing time interval on the timescale.