Starting an Optimization
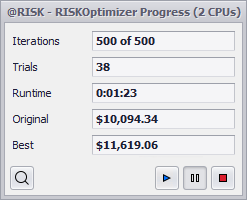
Figure 1 - RISKOptimizer Progress Window
The Start command starts an optimization of the model in the active workbook. During the optimization, either the RISKOptimizer Progress Window or the RISKOptimizer Watcher will be displayed. When the optimization has ended, the Watcher will be displayed, showing the Stopping Options tab.
RISKOptimizer Progress Window
While RISKOptimizer is running, the RISKOptimizer Progress window is displayed (Figure 1, right).
A summary of the status of the optimization, including the number of trials run, total run time, and the best solution found is included in this window. The command buttons (in the lower right of this window) include options to Restart, Pause, or Stop the optimization while the Watcher button in the lower left brings up the more sophisticated Watcher window.
RiskOptimizer Watcher
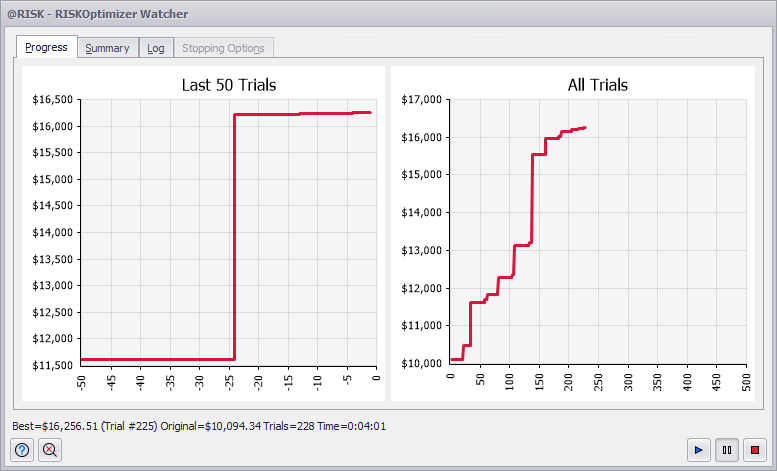
Figure 2 - RISKOptimizer Watcher Window Progress Tab
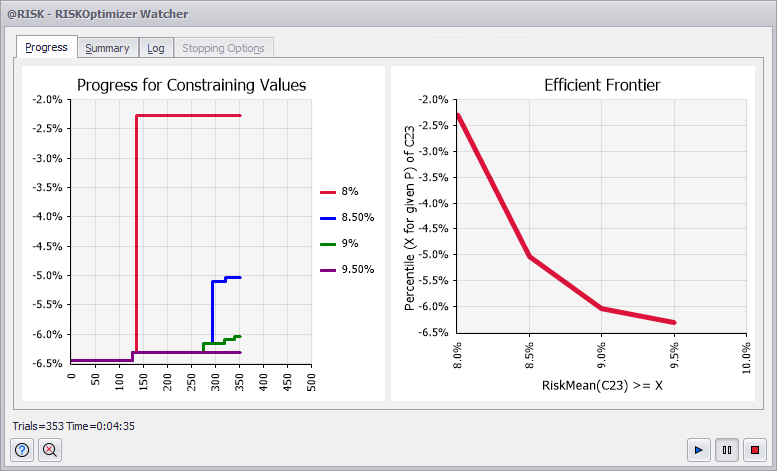
Figure 3 - RISKOptimizer Watcher Window Efficient Frontier Analysis
The magnifying glass icon on the RISKOptimizer Progress window (lower left corner of the window) opens the RISKOptimizer Watcher window (Figure 2, right). The RISKOptimizer Watcher is a dashboard that shows real-time results of an optimization in progress. This window also appears automatically when an optimization is complete. The Watcher window has several tabs, detailed below.
Progress Tab
For a standard optimization, the Progress tab (Figure 2, right) shows a pair of graphs showing how the optimal results are changing as more and more trials are run. The graph on the left shows progress over the latest trials, while the right graph show the progress over all the trials.
During an Efficient Frontier analysis, the Watcher window shows different information (Figure 3, right). On the left of the window, the progress for each of the alternative constraining values is shown, while on the right the efficient frontier boundary is mapped out.
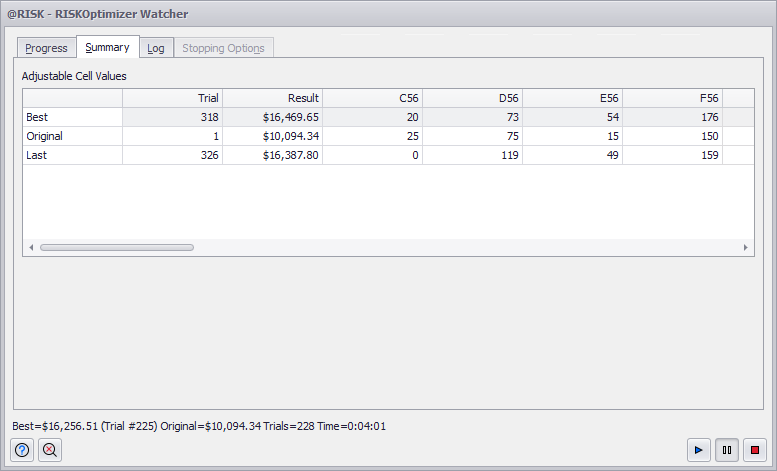
Figure 4 - RISKOptimizer Watcher Summary Tab
Summary Tab
The Summary tab displays a summary table of adjustable cell values tested during the optimization. If the Genetic Algorithm engine is in use, tools for adjusting the crossover and mutation rate for each Adjustable Cell Group in the model are also displayed.
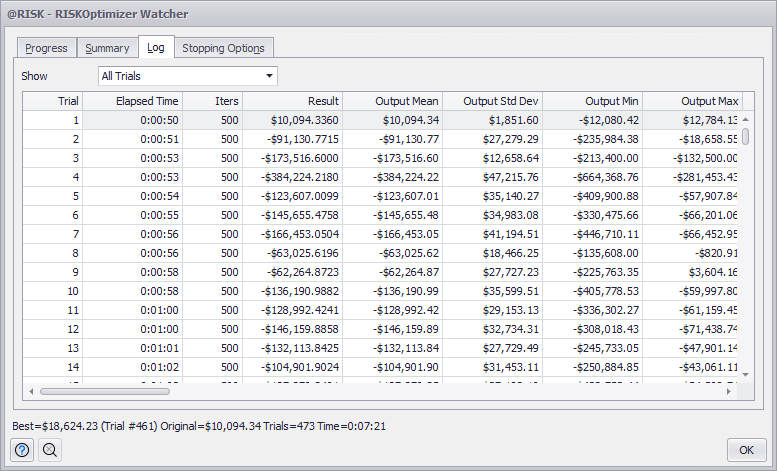
Figure 5 - RISKOptimizer Watcher Log Tab
Log Tab
The Log tab displays a summary table of each simulation run during the optimization. The log includes the results for the target cell, each adjustable cell, and all constraints.
The log contains the following information:
Population Tab
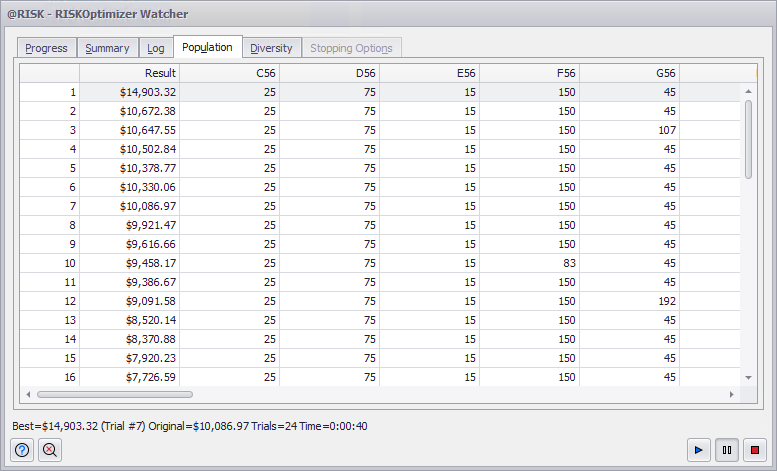
Figure 6 - RISKOptimizer Watcher Population Tab
If the Genetic Algorithm engine is being used, the Population tab is shown. This window displays a grid that lists all the variables of each organism (each possible solution) in the current population. These organisms are ranked in order from worst to best. In addition, the first column shows the value of the target statistic for each organism.
Diversity Tab
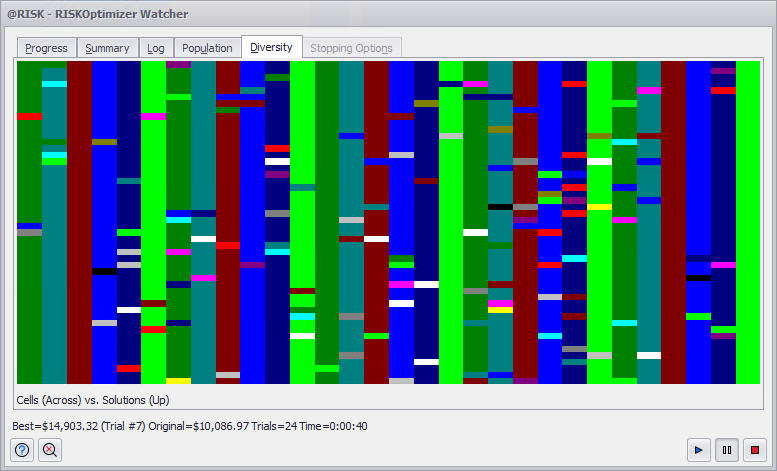
Figure 7 - RISKOptimizer Watcher Diversity Tab
If the Genetic Algorithm engine is being used, the Diversity tab is shown. The plot on the Diversity tab assigns colors to adjustable cell values, based on how much the value of a given cell differs across the population of organisms (solutions) that are stored in memory at a given point. (Using the genetic optimization terminology, this is an indication of the diversity that exists in the gene pool.) Each vertical bar in the plot corresponds to one adjustable cell. Horizontal stripes within each bar represent the values of that adjustable cell in different organisms (solutions). The colors of the stripes are assigned by dividing the range between the minimum and maximum value for a given adjustable cell into 16 equal-length intervals; each of the intervals is represented by a different color. For example, if a vertical bar is single-color, the corresponding adjustable cell has the same value for each solution in memory.
Stopping Options Tab
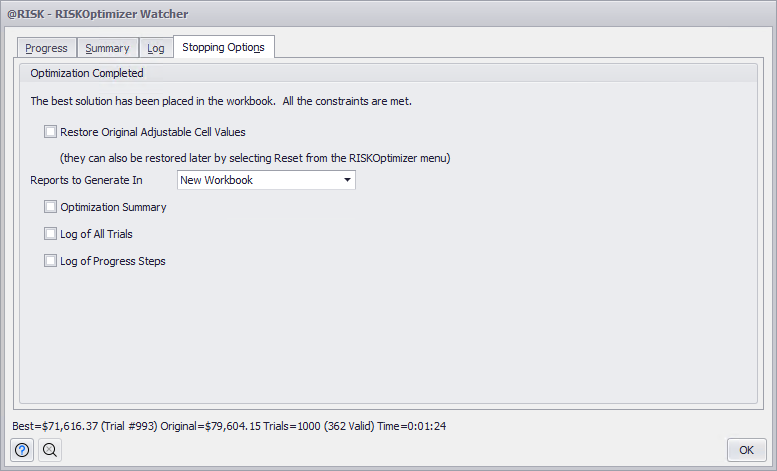
Figure 8 - RISKOptimizer Watcher Stopping Options Tab
When any of the RISKOptimizer stopping conditions are met, or if the stop button is pressed from either the progress window or the Watcher window, the Stopping Options tab is displayed.
There are several reports that can be generated at the end of the optimization. These report options are also available directly from the Optimize menu in the ribbon after the dialog is closed. In addition to setting where the reports will be generated, the following reports are available: