Summary Manager
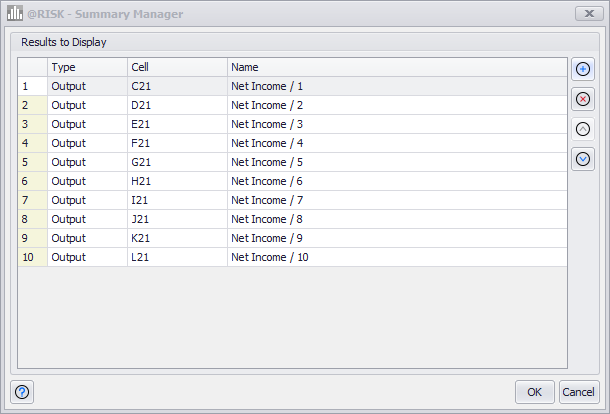
Figure 1 - Summary Manager
The Summary Manager (Figure 1, right) enables the configuration of elements included in a Summary Graph (either a Summary Trend or Summary Box Plot graph). @RISK inputs and outputs can be added to the summary graph, and the order of elements in the graph can be rearranged.
The Summary Manager contains a table consisting of one row for each element displayed on the graph. Its columns include:
There are four buttons to the right of the Summary Manager: