Stress Analysis Simulations
The Stress Analysis command of the Simulation menu will run an analysis of the effects of stressing @RISK distributions. “Stressing” a distribution restricts samples drawn from the distribution to values between a specified pair of percentiles (e.g. only values that fall between the 30th and 60th percentiles). Alternatively, stressing can be done by specifying a new “stress” distribution that will be sampled instead of the original distribution in a model. With Stress Analysis a number of @RISK distributions can be selected simultaneously and simulations run while stressing these distributions jointly - either in one simulation, or separately in multiple simulations. By stressing the selected distributions, analysis of scenarios can be done without changing the overall model.
After completing a simulation, Stress Analysis provides a collection of reports and graphs useful for analyzing the effects of stressing certain distributions on the selected model output.
To run a Stress Analysis simulation, select Stress Analysis from the Simulate menu, configure the output and inputs (see below), and click Analyze.

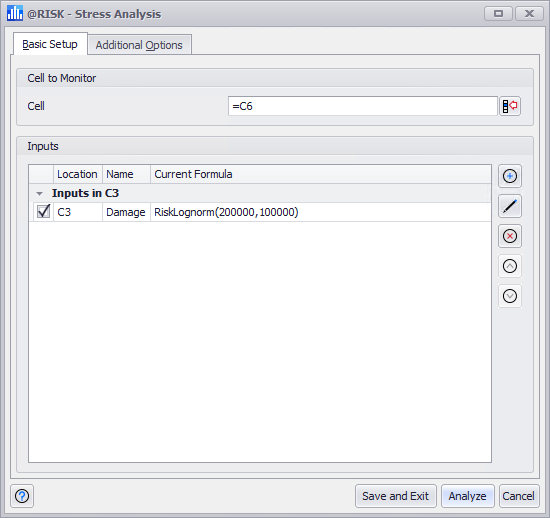
Figure 1 - Stress Analysis Window
The Stress Analysis window (Figure 1, right) contains the following configurations:
To add an input group to be stressed, click the Add (  ) button.
To edit or delete an input, select it in the list and click the Edit (  ) or Delete (
  ) button.
To reorder input groups, select an input group and use the Up and Down arrows
Configuring Stressed Inputs

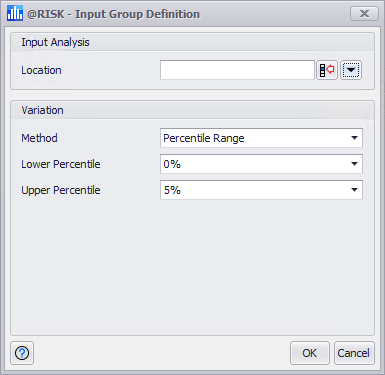
Figure 2 - Input Group Definition Window - Stress Analysis
When the Add or Edit buttons (see above) are clicked, the Input Group Definition window (Figure 2, right) will open, allowing a new input to be defined or an existing input to be modified. The Input Definition window contains the following configurations:
 ) to open the Range panel where cell ranges - both contiguous and non-contiguous - can be defined.
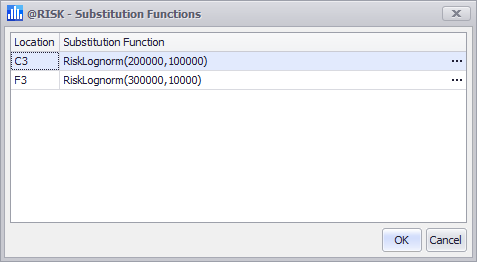
 ) to the right of each function to open Excel's Function Wizard.