Statistical Summary

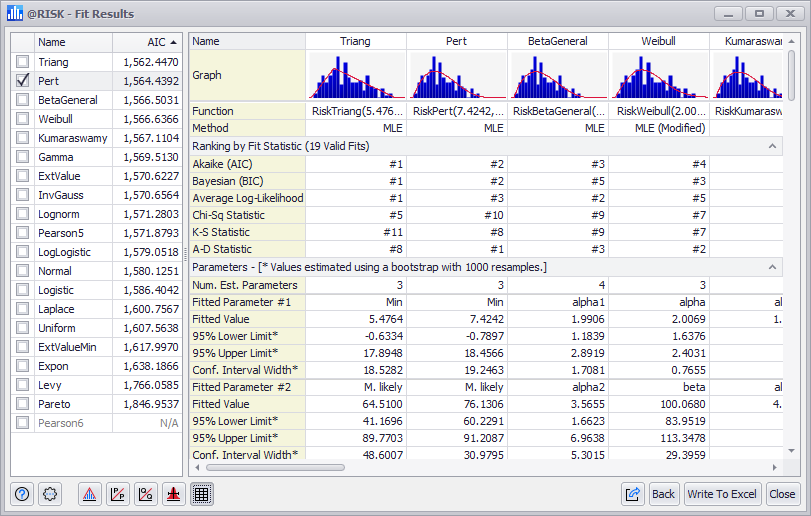
Figure 1 - Statistical Summary View
The Statistical Summary view (Figure 1, right) of the Fit Results window displays the calculated statistics and other information for all fitted distributions that were tested during the fitting process.
The Statistical Summary view can include a large amount of data, especially if bootstrapping was included in the fitting process. It is recommended to maximize the window. Additionally, resizing a column will resize all columns to match.
The data displayed includes a graph of the data overlaid with the distribution function graph, as well as the following categories of data:
For Chi-Squared Test, K-S, and A-D options, the statistics also include: