Scatter Plot Legends
Scatter graphs can be displayed with a number of different types of legends, or no legend at all. This is controlled by the legend selector at the top right of the graph.
The legend for a scatter plot can be further configured using the Legend Tab of the Graph Options dialog.
The types of legends are:
Legend - A simple legend showing the name of each scatter curve being graphed next to a graphical indicator for its color and format.

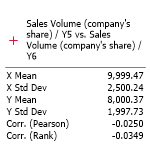
Legend (with Statistics) – A more sophisticated legend with additional statistics.

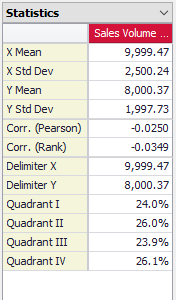
Statistics Grid – A table that includes a set of summary statistics and percentiles. Legend information is shown at the top of the table and each curve in the graph is shown in a single column.

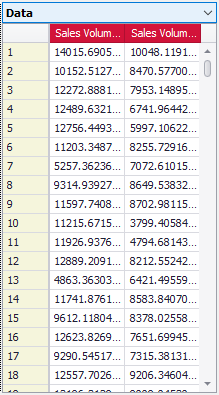
Data Grid – A table that includes all the data values. Legend information is shown at the top of the table.

None – No legend will be displayed.