RiskCumulD
|
Description |
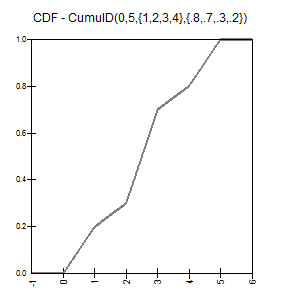
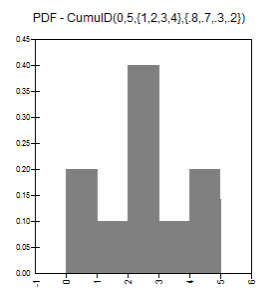
RiskCumulD(minimum,maximum,{X1,X2,..,Xn},{p1,p2,..,pn}) specifies a cumulative distribution with n points. The range of the cumulative curve is set by the minimum and maximum arguments. Each point on the cumulative curve has a value X and a probability p. Points on the cumulative curve are specified with increasing value and decreasing probability. Each probability entered is a cumulative descending probability, that is, the probability of a value greater than the entered X value. Any number of points may be specified for the curve. Note that even though the X,p pairs “define” the distribution, any value between minimum and maximum can be returned.
|
|
Examples |
RiskCumulD(0,10,{1,5,9},{0.9,0.3,0.1}) returns a cumulative curve with 3 data points and a range of 0 to 10. The first point on the curve is 1 with a cumulative descending probability of 0.9 (10% of the distribution values are less than or equal to 1, 90% are greater). The second point on the curve is 5 with a cumulative descending probability 0.3 (70% of the distribution values are less than or equal to 5, 30% are greater). The third point on the curve is 9 with a cumulative descending probability of 0.1 (90% of the distribution values are less than or equal to 9, 10% are greater). RiskCumulD(100,200,A1:C1,A2:C2) returns a cumulative distribution with 3 data points and a range of 100 to 200. Cells A1 through C1 hold the values of each data point, and cells A2 through C2 hold the cumulative probability at each of the 3 points in the distribution. Note that curly braces are not required when cell ranges are used as entries to the function.
|
|
Guidelines |
The points on the curve must be specified in order of increasing value (X1 < X2 < ... < Xn). The cumulative probabilities p for must be between 0 and 1 and in order of decreasing probability ( minimum must be less than X1 and maximum must be greater than Xn. The maximum number of X,p pairs is 2,147,483,647. |
|
Parameters |
min continuous parameter min < max max continuous parameter {x} = {x1, x2, ..., xN} array of continuous parameters {p} = {p1, p2, ..., pN} array of continuous parameters |
|
Domain |
|
|
Density and Cumulative Distribution Functions |
The arrays are assumed to be ordered from left to right. The i index runs from 0 to N+1, with two extra elements:
|
|
Mean |
No Closed Form
|
|
Variance |
No Closed Form
|
|
Skewness |
No Closed Form
|
|
Kurtosis |
No Closed Form
|
|
Mode |
No Closed Form
|
|
Examples |
|
 ).
).

 continuous
 for
for 
 for
for 
 and
and  .
.