During an Optimization
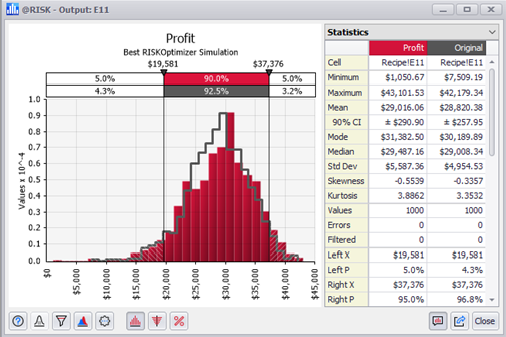
Figure 1 - Browse Results Window
While an optimization is running, RISKOptimizer will improve distributions of values. This is illustrated in the Browse Results window both during and after an optimization (Figure 1, right). The Browse Results windows shows the distribution of values for the target cell both before and after the optimization. The original distribution of values is illustrated by the grey line graph and in the Statistics window (if selected) under the "Original" column. The best distribution found is illustrated in red (both in the graph and in the Statistics column).
Please note: The Browse Results window will only be shown during an optimization if “Show Output Graph” is checked in the View tab of the Simulation Settings dialog and if a statistic of the target cell is being optimizer. The Browse Results window will NOT show if the ‘Value’ option is selected in the Optimization option of the Model Definition window (pictured, right).
Additionally, the “Original” distribution will not be displayed if the optimization constraints are not met when the optimization is started.