Summary Graphs and Multiple Simulations

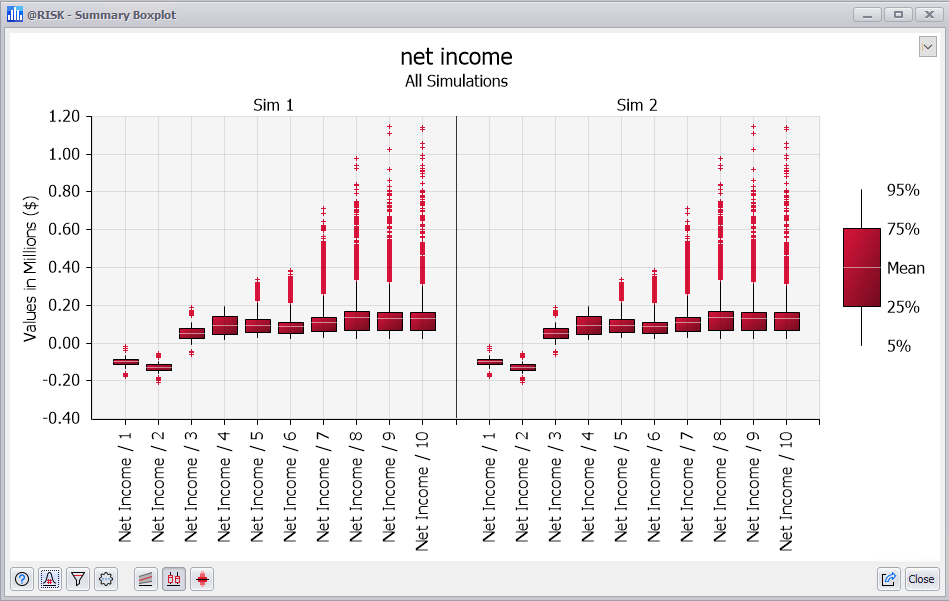
Figure 1 - Summary Box Plot Graph - Multiple Simulations
When a simulation is run utilizing multiple simulations, each simulation's results can be displayed in the Summary View window separately, or all simulation results can be combined into a single view.
By default, the Summary window will indicate the simulation being viewed in a few ways:
- The graph title will display the simulation number, or 'All Simulations' when viewing all simulation results
- The graph will display a graph for each simulation, with the simulation number displayed above the graph.
To switch between simulations, or to toggle 'All Simulations', use the Select Simulation # to Display button (  ) in the command buttons. See Summary View Command Buttons, below, for more information.