Bootstrap Analysis
When a Parametric Bootstrap is run during the fitting process (see Fit Bootstrap for more information), the Fit Results will include the Bootstrap Analysis option. Otherwise, the button is disabled. When a bootstrap analysis is run, a distribution is generated for the values for each parameter in the fitted distribution. The Bootstrap Analysis (Figure 2, below) includes distributions and statistics for fitted parameters and goodness-of-fit statistics.
Bootstrap Analysis Views
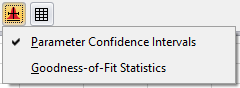
Figure 1 - Bootstrap Analysis
There are two options available to view the Bootstrap Analysis results, available by clicking on the Bootstrap Analysis button (Figure 1, right). The two views are Parameter Confidence Intervals and Goodness-of-Fit Statistics.
Selecting a view will change the options available in the Selection Panel, located above the Graph and Information Panels. When 'Parameter Confidence Intervals' is selected, the Selection Panel will list the fitted parameters for the selected distribution; when 'Goodness-of-Fit Statistics' is selected, the selection panel will list the three methods used to calculate goodness-of-fit (see Goodness-of-Fit Statistics, below).
To view the analysis for a fitted distribution, check the box next to its name in the Distribution List. Please note, only one distribution can be selected at a time.
To view the distribution graph for a parameter, or for a goodness-of-fit method, click the item in the Selection Panel. The graph area includes a label for the fitted parameter value or the goodness-of-fit value (Item 5 in Figure 2, below) as well as a graph of the bootstrap analysis data.
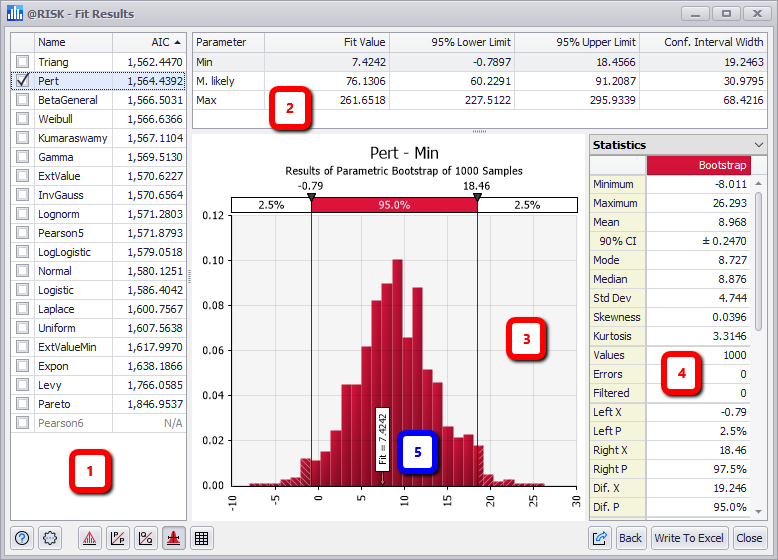
Figure 2 - Fit Results Window - Bootstrap Analysis View
Bootstrap Analysis View
The Bootstrap Analysis View consist of the following primary sections:
- Distribution List
- Selection Panel
- Graph Panel
- Information Panel
- Fitted Parameter Value Labelor Goodness-of-Fit Value