Output Options
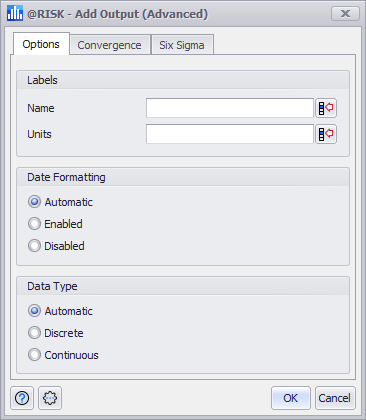
Figure 1 - Output Options
The Options tab of the Add Output (Advanced) window (Figure 1, right) includes the primary configurations for the Output, and is organized into three sections.
Labels
Date Formatting
@RISK will automatically detect Excel's display settings for a cell, so a cell that is set as a Date will register as a Date when using the 'Automatic' setting for Output Date Formatting. However, if this option should be overridden, choose 'Enabled' or 'Disabled' as appropriate.
Enabling the Date Formatting option in the Output configuration will not change the cell formatting in Excel; if a cell should display as a Date in the worksheet, it must be configured as a Date on the Home tab under the Number section.
Enabling or Disabling the Date Formatting in the Output configuration will affect both the graph and table output that @RISK generates.
Data Type
When the Data Type option is set to 'Automatic', @RISK will use the results of a simulation to determine if an Output is discrete or continuous; this affects the graph that is generated for the Output. This behavior can be overridden by manually setting the Output to either 'Discrete' or 'Continuous' as appropriate.