Modifying Distributions
After a distribution has been drawn, @RISK will convert the drawn curve into a graph using a set number of points on X,Y coordinates, represented as dots on the graph, that match the freeform curve. The number of points (or bars in the case of Histograms and Discrete Probabilities), and hence the detail of the resulting graph, is set in the Distribution Artist Options window. Additionally, when the mouse button is released to complete drawing, @RISK will automatically plot the endpoints of the graph at the minimum and maximum values that were set in the Distribution Artist Options window.
Right-click on the graph to open a contextual menu (Figure 1, below) with the following options:
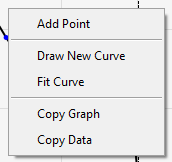
Figure 1 - Right-click on graph
In addition to using the right-click menu, once a curve has been drawn it can be modified in other ways, detailed below.
Editing Points
Individual points or bars on the graph can be moved, within some limitations.
To reshape a graph, move the mouse over the point (or the top of the bar for histograms and discrete probabilities); when the cursor becomes a four-way arrow, click-and-hold and drag to move. The following limitations apply:
| Graph Type | Move Coordinates | Notes | |
| X-Axis | Y-Axis | ||
| Probability Density (General) | Yes | Yes | Point cannot move beyond adjoining points on X-Axis |
| Probability Density (Histogram) | Yes | No | Bar can only move along Y-Axis |
| Cumulative Ascending | Yes | Yes | Moving point on Y-axis will affect adjoining points |
| Cumulative Descending | Yes | Yes | Moving point on Y-axis will affect adjoining points |
| Discrete Probability | Yes | Yes | Bars can be moved on both X-Axis and Y-Axis |
Minimum and Maximum Values
The minimum and maximum values for the distribution are represented on the graph by dotted lines. The curve of the graph cannot be drawn outside these delimiters, and no point or bar can be moved beyond them.
To change the minimum and/or maximum values of the distribution, hover the mouse over the line to be moved and click-and-drag to reposition.
Do not use the Draw New Curve button to edit an existing curve! Using this dialog will clear the existing graph so that a new one can be drawn!