Define Copula

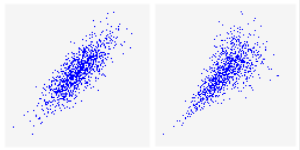
Figure 1 - Gaussian Pattern (Left) vs. Clayton Copula Pattern (Right)
Much like a correlation matrix, a copula can be used to correlate two or more input distributions; however, there are key differences between using a correlation matrix and using a copula, and the outcomes can be significantly different. The primary difference exists in the pattern of samples returned by each distribution in relation to their correlated inputs. When using a correlation matrix, the pattern is always an "Elliptical Gaussian" pattern whereas a copula can utilize different shapes. Figure 1, right, demonstrates an example of the difference between the two.
Adding a copula to input distributions adds the RiskCopula property function to the @RISK distribution function. For example, the following input:
=RiskNormal(0.055,0.085)
Is updated as follows when added to a copula named "MyCopula":
=RiskNormal(0.055,0.085,RiskCopula(MyCopula,1))
Correlation matrices and copulas are two methods for modeling relationships between input distributions; adding or editing either a correlation matrix or a copula in @RISK follows a very similar process. However, there are some key differences between the two elements, and in the potential outcomes for input distributions. Please refer to Correlations and Copulas in the Statistics section of this guide for more information.
Specifying Inputs

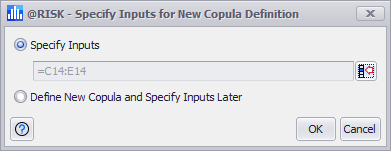
Figure 2 - Specify Inputs Window
When creating a new correlation matrix, the first window that opens is the Specify Inputs window (Figure 2, right). The Specify Inputs window includes two options: