Adding Overlays
Overlays are a useful tool for comparing several distributions to each other on the same graph. In the context of defining an input distribution, adding an overlay enables comparison of the currently configured distribution to other distributions, each with their own configurations. Using this comparison, the appropriateness of distributions can better be determined.
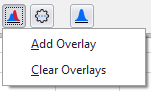
Figure 1 - Add Overlay
From the Define Distribution window, overlays can be added to the graph by clicking the Overlays button in the Command Buttons area (Figure 1, right). This menu includes two options - 'Add Overlay' and 'Clear Overlay'.
Select 'Add Overlay' to open the Select Function window and choose an additional distribution to use in comparison. Double click the distribution icon or select it and click 'Select Distribution' to add that distribution to the graph.
When adding an overlay, it's possible to use an existing distribution from another cell by using the 'Choose a distribution from an Excel cell' button (  ) in the Command Buttons of the Select Function window; distributions from the same sheet or a different sheet can be added.
The 'Clear Overlay' option will only be available if overlays have been added to a graph; select it to clear all overlays from the graph.
See Overlays in the Graphing section for more information on working with Overlays.