Release Notes
Release 8.2.2 - March, 2022
Fixes
| DTS-2784 | Unable to visualize the Probability Density graph for Burr12 due to X-Axis scaling | @RISK |
| DTS-2795 | Error message when adding an output to cells with Excel Names starting with the word "True" | @RISK |
| DTS-2604 | Unable to select network licenses when there are two license servers running | Licensing |
| DTS-2633 | Unable to select network licenses because the server is not replying to client messages | Licensing |
Release 8.2.1 - December, 2021
Highlights
@RISK: Time Series Fitting Increased Range Limits
The number of data points that can be used in Time Series Fitting has been significantly increased; longer time series data - up to a million data points - can now be used effectively, though the fitting process may still take significantly longer with larger data sets.
Additionally, the historical graph in Time Series graphs will only display 2000 data points, no matter how large a data series is used.
Please note: @RISK will no longer try to prevent Time Series Fitting with any data series, but larger data sets may cause "out of memory" errors and other unexpected behavior.
Enhancements
| DTS-2433 | Time Series Fitting Increased Range Limits | @RISK |
Fixes
| DTS-2105 | Hidden Sheet data overwrites existing model worksheet | @RISK |
| DTS-2184 | Negative Values for the omega parameter of an EGARCH model return errors | @RISK |
| DTS-2248 | Creating reports with tracking statistic of Standard Deviation crashes Excel | @RISK |
| DTS-2273 | @RISK crashes when defining new Time Series with transformations | @RISK |
| DTS-2330 | Browse Results Window does not display graph after changing number of simulations | @RISK |
| DTS-2354 | Model List closes when trying to open Define Distribution Window when a function includes incorrect arguments | @RISK |
| DTS-2379 | Valid Time Series fit returns #VALUE! error when writing to Excel | @RISK |
| DTS-2413 | Input names in Tornado graphs don't display when RiskName references Excel Table Headers | @RISK |
| DTS-2416 | Chinese characters in workbook name prevent multiple CPU simulations from running | @RISK |
| DTS-2577 | Running multiple CPU simulations causes exception errors | @RISK |
| DTS-2583 | Input Report Setup does not update group option when a Time Series Report is selected | @RISK |
| DTS-2603 | Detailed Statistics Report is generated even when no simulation data exists | @RISK |
| DTS-2609 | Opening a swapped-out file closes Excel | @RISK |
| DTS-2182 | Data Viewer - Chart in Excel option does not work | NeuralTools, StatTools |
Release 8.2 - July, 2021
Highlights
@RISK: Dynamic Array Functions
Six new @RISK formulas allow you to create Excel dynamic arrays with @RISK simulation data, results are returned in a dynamic array of whatever size is necessary to hold the values:
- RiskDataDA: returns the simulated data value(s) of simulation.
- RiskSensitivityDA: returns the sensitivity analysis information of simulated output.
- RiskSensitivityStatChangeDA: returns the “change in output statistic” sensitivity analysis information of the simulated output.
- RiskFitParametersDA: returns the values for the parameters of the best fitting distribution from the fit performed by the RiskFitDistribution.
- RiskFitStatisticsDA: returns the statistics from the fit performed by the RiskFitDistribution.
- RiskCorrectCorrmatDA: returns a corrected correlation matrix.
- RiskSimulationInfoDA: returns all simulation information options in one dynamic array.
This functionality only works on Office 365 with Excel Dynamic arrays.
See these online examples to see how @RISKDataDA and @RISKSensitivityDA can be used to create dynamic Excel Charts:
Dynamic Arrays - RiskDataDA with an LDA Base Model
Dynamic Arrays - RiskSensitivityDA with a New Product Development Base Model
@RISK: Error Handling with Debugging Messaging
There is a new Error handling functionality that will identify misconfigured or incorrect @RISK elements, including distribution functions, outputs, and @RISK statistic functions.
This release includes the following Error Handling:
Distribution Functions error warnings and explanations are included in the Define Distribution, Model List, and the Results Summary Windows and can be seen by hovering over the icon.
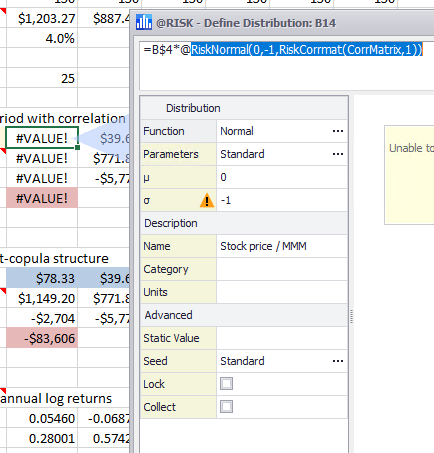
Figure 1 - Distribution Function Error Warning
All @RISK functions with error warnings can be filtered in the Model List and the Results Summary Windows using the new Issue View button (  ).
).
Details of the error from a cell with a Distribution Function can be viewed in the Excel status bar at the bottom of the Excel window.
Output and Statistical Function errors resulting from their precedent distribution functions with errors are included in the Results Summary Windows and can be seen by hovering over the icon.
@RISK: Added Letter Value Graphs
The Letter Value graph is a new Summary Graph that takes a Box Plot Graph to the next level! It graphs the spread with a variable number of letter value boxes. You will be able to visualize better estimates further out into the tails and reduced number of “outliers” displayed for large data sets.
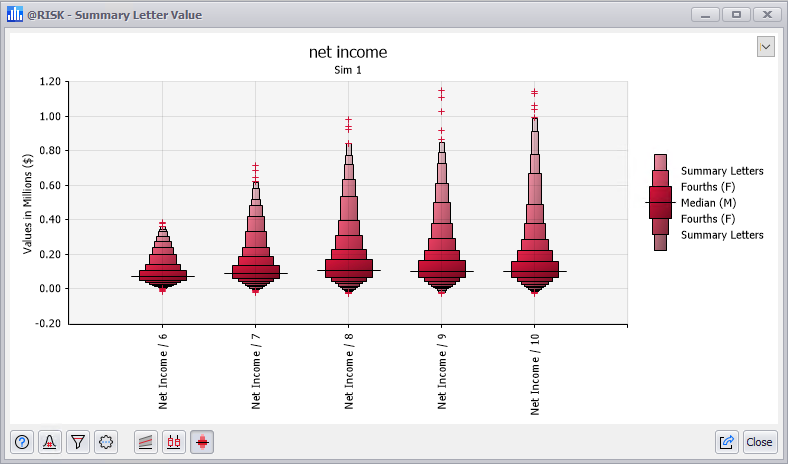
Figure 2 - Summary Letter Value Graph
See this online example to see how this new graph is used in a Operational Risk model:
Letter Value Graph - Letter Value Graph with an LDA Base Model
@RISK: Select from Multiple Sheets When Creating Scatter Plots
The dialog to create Scatter Plot Graphs has been updated to allow selecting inputs and outputs from multiple worksheets.
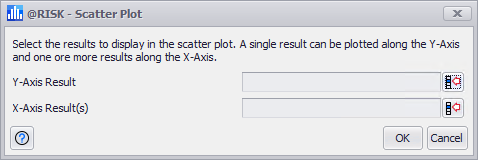
Figure 3 - Scatter Plot - Select Axis Window
@RISK: Swap Overlayed Distributions
The Define Distribution window now allows for swapping overlay distributions with the original distribution, replacing the original @RISK function with the overlay's @RISK function. This enables quick comparison of input definitions and quick selection of the distribution that is most appropriate to the model.
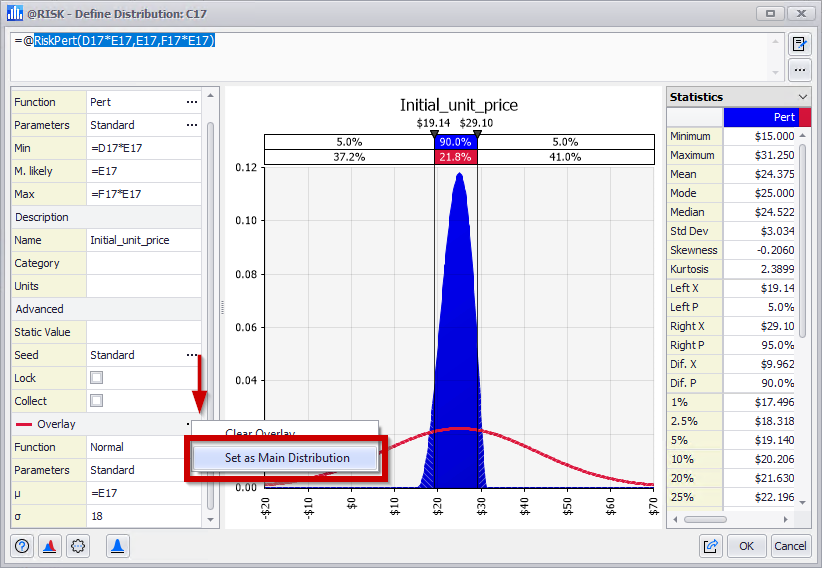
Figure 4 - Define Distribution - Swap Overlay
@RISK: Export Simulation Data from Graph Windows
The Browse Results, Scatter Plot, and Summary Graphs Windows now have the option to Export or Copy the Simulation Data for the displayed inputs or outputs.
@RISK: Simulation Data Report
The new Simulation Data Report now allows for the selection of inputs and/or outputs to generate a report with their Simulation Data in an Excel Worksheet.
@RISK: Input/Output Thumbnails in Data Window
Thumbnail graphs for inputs and outpus are now included in the Data Window, aiding in the interpretation of simulation results.
@RISK: Sampling Type and Generator Added to RiskSimulationInfo
Two new arguments have been added to the @RISK function RiskSimulationInfo; these will display the Sampling Type and Generator used during the simulation.
@RISK: New Advanced Sensitivity Analysis User Interface
The @RISK Advanced Sensitivity Analysis feature has been updated with an improved user interface and experience.
@RISK: New License Manager User Interface
The @RISK License Manager feature has been updated with an improved user interface and experience.
@RISK: New Software Update User Interface
The @RISK Software Update feature has been updated with an improved user interface and experience.
NeuralTools: Updated Warnings
Now when testing or predicting PN/GRN nets there are also warnings for the number of test and prediction cases whose values are not between the minimum and maximum of the corresponding training variables. These warnings can be found in the Preview dialogs, Reports and as a note in the Live Prediction cell for numeric independent variables.
Enhancements
| DTS-1675 | SmartSensitivity Analysis works with Excel LAMBDA functions | DecisionTools Suite |
| DTS-303 | Letter Value Graph added to Summary Graphs group and views | @RISK |
| DTS-392 | Error handling with useful debugging information across the user interface | @RISK |
| DTS-402 | @RISK Dynamic Array Functions | @RISK |
| DTS-483 | New License Manager User Interface | @RISK |
| DTS-485 | New Software Update User Interface | @RISK |
| DTS-644 | Sampling Type and Generator added to RiskSimulationInfo | @RISK |
| DTS-1009 | Export Simulation Data from Graph Windows | @RISK |
| DTS-1032 | Select one of the overlayed distributions to replace the original one | @RISK |
| DTS-1236 | Select inputs/outputs from multiple sheets when creating a Scatter Plot | @RISK |
| DTS-1240 | New Advanced Sensitivity Analysis User Interface | @RISK |
| DTS-1320 | Simulation Data Report | @RISK |
| DTS-374 | Warnings for cases outside the range of training data | NeuralTools |
Fixes
| DTS-124 | Registry Key is inaccessible if the first run of the product after install is under an Admin Account but subsequent runs are not | @RISK |
| DTS-1470 | RiskSimulationInfo function is showing #N/A when opening a file with simulation data saved in it | @RISK |
| DTS-1628 | Macro file in XLSTART directory prevents multiple CPUs from being used | @RISK |
| DTS-1747 | Adding RiskVary overlay in Define Distribution window doesn't make use of parameters of underlying distribution | @RISK |
| DTS-1799 | RISKOptimizer models with correlations matrices can cause Excel to crash when running with multiple CPU | @RISK |
| DTS-1957 | RiskCumul showing different results for Standard Deviation between @RISK versions | @RISK |
| DTS-1970 | Models with linked fits crashed on Windows 7 | @RISK |
| DTS-1988 | Saving an @RISK model workbook is not possible after deleting some columns with distributions functions | @RISK |
| DTS-2035 | Excel crashes with multiple CPU simulations | @RISK |
| DTS-2110 | Error when generating a Sensitivity Scatters Report in active workbook | @RISK |
| DTS-2113 | The XDK CreateScenarioReport method crashes Excel | @RISK |
| DTS-1369 | Cancelling prompt during uninstall doesn't stop the process if there's a borrowed license | Installer |
| DTS-1704 | Repair option is not working Server Manager | Licensing |
| DTS-1763 | Add missing Spanish example files so they can be accessed from the Examples worksheet | NeuralTools |
| DTS-1832 | Validation error on a non-active tab in Model Settings Dialog doesn't change tab to highlight error | PrecisionTree |
| DTS-1992 | Error message when defining input ranges in Sensitivity Analysis | PrecisionTree |
| DTS-1715 | TopRank analysis may crash if @RISK also loaded and displaying Browse Results Window | TopRank |
Release 8.1.1 - March, 2021
Enhancements
| DTS-301 | Installation now requires EULA approval | Installer |
| DTS-501 | Updated licensing components to use FlexNet version 11.18 | Installer |
| DTS-877 | StatTools and TopRank Spanish local documentation now available | Documentation |
Fixes
| DTS-1760 | Addin Launcher sometimes gets stuck at "Initializing Microsoft Excel..." | DecisionTools Suite |
| DTS-1381 | Dynamic Arrays compatibility problem when running a simulation with linked fit | @RISK |
| DTS-1478 | Filter definitions cleared after disabling All Filters and running a simulation | @RISK |
| DTS-1512 | Uncolored Tornado bar when baseline value is not within the bar values | @RISK |
| DTS-1531 | Progress Window incorrectly shows Multiple CPU recommendation when running a Goal Seek simulation | @RISK |
| DTS-1547 | Clear Filter option in the Single Filter dialog not working properly | @RISK |
| DTS-1553 | Define Distribution Window graph customization not saved properly | @RISK |
| DTS-1604 | Goal Seek can experience poor performance during simulation start | @RISK |
| DTS-1631 | Error in Define Correlation Matrix when active cell contains special characters | @RISK |
| DTS-1707 | Graph customization lost when Excel file loaded before @RISK is started | @RISK |
| DTS-1741 | Distribution fits with input data filters not working correctly in all cases | @RISK |
| DTS-1475 | Linear Prediction does not work in the 8.1.0 release | NeuralTools |
| DTS-1499 | Number of Trials in the Summary Report is always zero | NeuralTools |
Release 8.1 - November, 2020
Highlights
All Products: Spanish Translation
The user interface for all the version 8.0 add-ins in the DecisionTools Suite have been translated into Spanish.

While the user interface and example files have all be localized into Spanish, unfortunately the Spanish product documentation was not completed as of the release date. Only the Evolver, PrecisionTree, and NeuralTools documentation is available in this release. If you are using @RISK’s online help system, the product will automatically start delivering Spanish documentation content as soon as it becomes available. If you are using the local help system of @RISK or the other products, you will need to update your software to get the translated documentation.
@RISK: Disable All Correlations During Simulations
There is a new Simulation Setting on the Sampling Tab (Figure 5, below) to disable all the correlations defined in your model. A shortcut for this setting can also be found in the Correlation Menu (Figure 6, below).
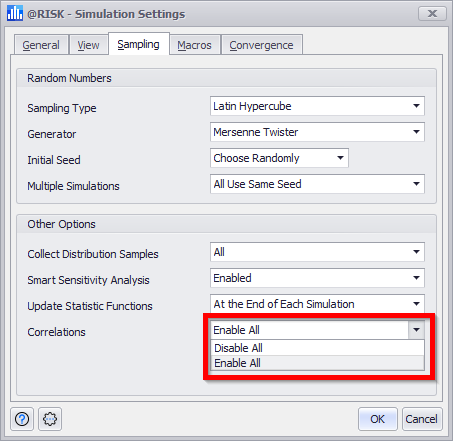
Figure 5 - Sampling Settings
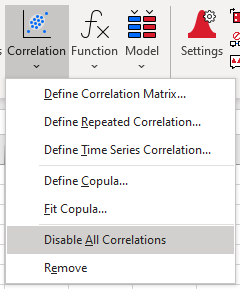
Figure 6 - Correlation Menu
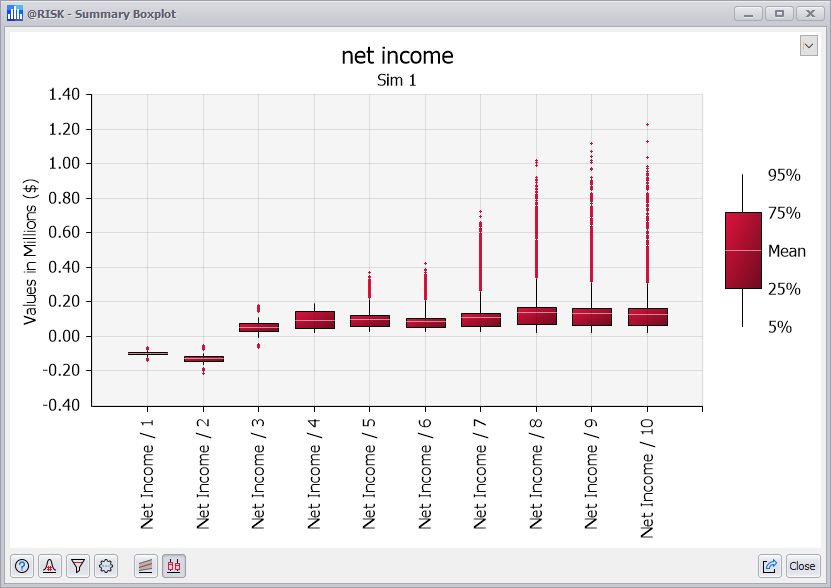
@RISK: Identify and Graph Outliers in Box Plots
Box Plots on the Summary Window or Data Viewer Window can now display outliers. This can be customized for an individual graph from the Graph Options dialog, or for all graphs from within @RISK’s Graphing Preferences dialog.
@RISK: Calculate Joint Probabilities Using New Statistic Functions
Two new @RISK statistic formulas allow you to calculate joint probabilities for two or more simulated input or outputs.
-
RiskJointProb2Dim calculates the fraction of iterations where a two simulated outputs or inputs fall in a given quadrant. (This matches the results shown by the delimiters in an @RISK scatter graph.)
-
RiskJointProbMultiDim calculates the fraction of iterations where any number of outputs or inputs meet a given set of range conditions.
@RISK: Select Report Outputs and Inputs across Multiple Worksheets
This new feature allows you to select multiple Excel ranges from different worksheets in the same workbook (Figure 7, below). You can also delete specific ranges, or change the order of how they will be displayed in your report.
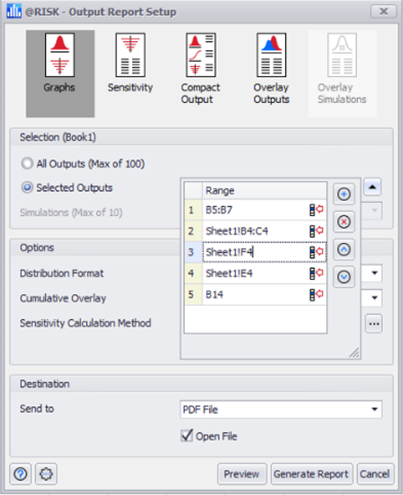
Figure 7 - Output Report Configuration
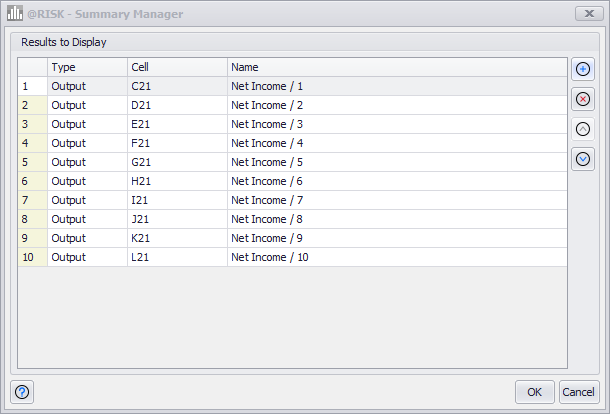
@RISK: Choose and Order Results in Summary Graphs
The Summary Trend and Box Plot graphs now have a Summary Graph Manager that allows you to add, remove, and order the inputs and outputs shown in the graph. You can find it in the Settings/Actions menu of the Summary Graph Window.
@RISK: Model List Status Column Helps Identify Locked Inputs
The Model List Window (Figure 8, below) and Results Summary Window (Figure 9, below) now include a status column to visually show when an input is locked. From the Model List, you can lock and unlock inputs from the Edit menu or right-click context menu.
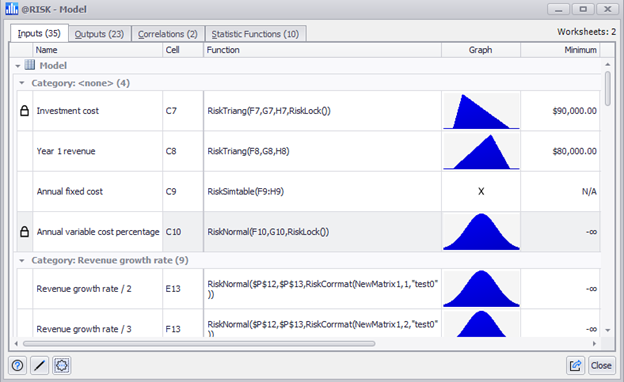
Figure 8 - Model List with Locked Inputs
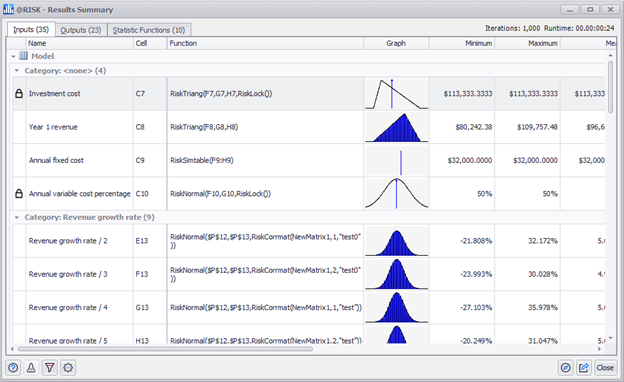
Figure 9 - Results Summary with Locked Inputs
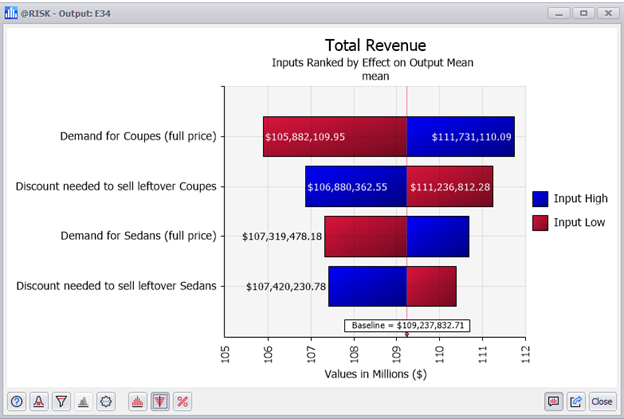
@RISK: Configure Two-Color Tornados
The Change in Output Statistic Tornado now allows the customization the two colors of the bars, so you can better differentiate between high and low inputs. The colors can be controlled for an individual graph using the Graph Options dialog. To control the colors for all new graphs, go to the Graphing Preferences dialog.
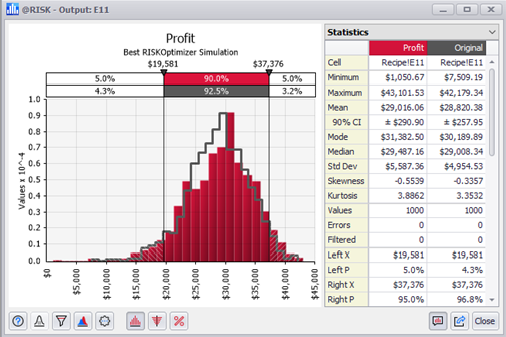
RiskOptimizer Graph to Compare Original vs Optimized Distribution
The Browse Results Window now allows you to compare the original distribution to the optimized distribution found by RISKOptimizer.
@RISK: New Dynamic Welcome Screen Content
Find the latest news from Palisade and @RISK in the new dynamic Welcome Screen. If you prefer to disable the Welcome Screen at startup, we’ll put notifications on the @RISK menu whenever there is new content available.
@RISK: Increased Report Limits
Summary and Detailed Statistics report tables can now include up to 500 inputs or outputs.
@RISK: New Goal Seek User Interface
The @RISK Goal Seek feature has been updated with an improved user interface and experience.
@RISK: Better Display Scaling
This version of @RISK has improved handling of different display scales (also known as DPI scales) in its windows, graphs, and reports.
@RISK: Add Property Functions from the Insert Menu
The ability to add Property Functions to your @RISK functions using the Insert Menu has been restored to @RISK version 8.
@RISK: Reference Overlays on Non-Active Sheets in the Define Distribution Window.
The option to overlay a distribution from an Excel range in the Define Distribution Window now supports selecting Excel cells from a non-active sheet.
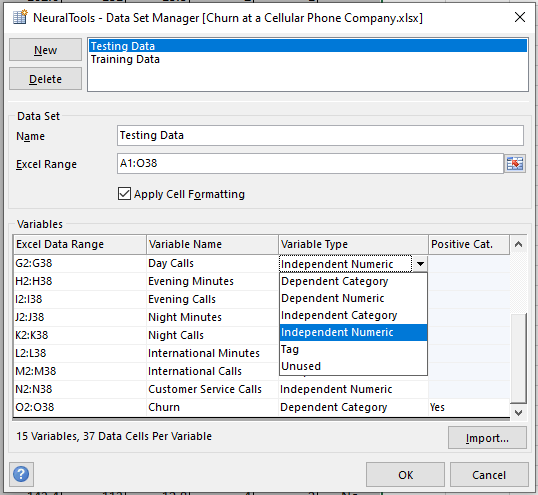
NeuralTools: New Classification Performance Measures Report
For binary classification problems, one of the values in the dependent variable can now be defined as the “Positive Category”. With this designation we can present the testing results in terms of True/False Positives or Negatives; as well as reporting Accuracy, Precision, Recall, and F1 Score for the neural net’s performance.
Enhancements
| DTS-63 | Choose and Order Results in Summary Graphs | @RISK |
| DTS-64 | Reference Overlays on Non-Active Sheets in the Define Distribution Window | @RISK |
| DTS-142 | Better Display Scaling | @RISK |
| DTS-201 | Added statistic table options to Graphing Preferences dialog | @RISK |
| DTS-302 | Identify and Graph Outliers in Box Plots | @RISK |
| DTS-377 | Disable All Correlations During Simulations | @RISK |
| DTS-383 | Configure Two-Color Tornados | @RISK |
| DTS-400 | RiskOptimizer Graph to Compare Original vs Optimized Distribution | @RISK |
| DTS-401 | Calculate Joint Probabilities Using New Statistic Functions | @RISK |
| DTS-411 | Add appropriate error messages when attempting to correlate uncorrelatable functions | @RISK |
| DTS-471 | Increased Report Limits | @RISK |
| DTS-481 | Add Property Functions from the Insert Menu | @RISK |
| DTS-499 | Improved handling of manually deleted correlation matrices and copulas | @RISK |
| DTS-512 | Support for worksheet-level correlation names | @RISK |
| DTS-606 | Restore Insert Property Function Menu to be part of the Ribbon options | @RISK |
| DTS-607 | Enabled Multiple reports dialog configuration for models without simulation results | @RISK |
| DTS-730 | Select Report Outputs and Inputs across Multiple Worksheets | @RISK |
| DTS-788 | New Dynamic Welcome Screen Content | @RISK |
| DTS-974 | Allow loading values from Excel range directly into Percentile Defaults Dialog | @RISK |
| DTS-1439 | Model List and Results Summary Status Column Helps Identify Locked Inputs | @RISK |
| DTS-720 | Simplified activation process to only offer manual activation after automatic activation failure | Licensing |
| DTS-381 | New Classification Performance Measures Report | NeuralTools |
Fixes
| DTS-11 | Negative values are not shown correctly in sensitivity report table | @RISK |
| DTS-12 | Incorrect column headers in "Overlay Simulations" report table | @RISK |
| DTS-13 | Incorrect table values shown in sensitivity report | @RISK |
| DTS-17 | Copying worksheets between two workbooks containing correlations with the same name can confuse @RISK | @RISK |
| DTS-18 | Fit Manager blocks adding fit to non-active workbook | @RISK |
| DTS-21 | Scenario Setttings not properly handling -Infinity as a lower bound | @RISK |
| DTS-23 | XDK Sensitivity Report sometimes showing incorrect table | @RISK |
| DTS-90 | Compact Output Report does not fit on one Excel page | @RISK |
| DTS-91 | PDF Reports not showing Chinese characters | @RISK |
| DTS-92 | Report worksheets can have naming conflicts | @RISK |
| DTS-118 | Incorrect worksheet names for some scenario reports | @RISK |
| DTS-133 | Bad Summary Statistics and Detailed Statistics report titles when using multiple named simulations | @RISK |
| DTS-144 | Saving a scenario setting as defaullt that doesn't use percentiles doesn't work correctly | @RISK |
| DTS-189 | Incorrect filter minimum and maximum shown in detailed statistics report | @RISK |
| DTS-267 | Report graph images can sometimes be blurry | @RISK |
| DTS-350 | Remove @RISK Functions does not display a warning message when trying to remove functions from a protected workbook | @RISK |
| DTS-372 | Error after deleting columns with correlation matrix | @RISK |
| DTS-412 | Swapping in @RISK function with Excel in manual recalculation mode shows #NAME? errors | @RISK |
| DTS-421 | RISKOptimizer sometimes sends reports to the wrong workbook | @RISK |
| DTS-422 | Mouse wheel no longer works when RISKOptimizer reports are sent to Active Workbook | @RISK |
| DTS-467 | Recently simulated file links in Welcome Screen do not work if files are saved in OneDrive | @RISK |
| DTS-469 | Error clicking in empty header column in Copula Fit Results window | @RISK |
| DTS-493 | Error inside Model dialog after deleting correlation matrices | @RISK |
| DTS-624 | Compact output report delimiter values do not match Left X and Right X summary statistics values | @RISK |
| DTS-634 | Sensitivity Report with Regression Mapped Values uses incorrect number formatting | @RISK |
| DTS-647 | Non US-English regional settings causing RiskCompound issues | @RISK |
| DTS-659 | Opening models that prompt to update links sometimes interfere with loading saved simulation settings | @RISK |
| DTS-660 | Error simulating RiskSplice distributions that have internal distributions that use the implicit intersection '@' symbol | @RISK |
| DTS-695 | Define distribution overlay reference is not updated when referencing a distribution in another cell | @RISK |
| DTS-696 | Define Distribution Window distribution panel scrolled incorrectly after exiting Free-Edit mode | @RISK |
| DTS-711 | Overflow error when changing alt parameterization in Define Distribution Window | @RISK |
| DTS-768 | Added support for date variables to summary graphs | @RISK |
| DTS-769 | Allow summary graphs to be created with a single variable | @RISK |
| DTS-783 | Graph options dialog sometimes not displayed after showing the Excel cells selector | @RISK |
| DTS-792 | Distribution Artist: Remove Bar is missing from the right-click menu | @RISK |
| DTS-798 | Output Range: When copy pasting the name of an individual ouput the information from the entire row is copied and pasted |
@RISK |
| DTS-811 | Specific large model either runs very slowly with Multiple CPUs | @RISK |
| DTS-818 | In Sensitivity Settings Dialog, removing selection for Must Change Statistic By doesn't update graph | @RISK |
| DTS-905 | Summary Trend and Summary Box Plot graphs do not retain currency formatting of inputs/outputs | @RISK |
| DTS-918 | External function calls inside RiskName field can cause crashes when opening a model | @RISK |
| DTS-975 | Error with Spanish regional settings and output with name defined using a disjoint range | @RISK |
| DTS-976 | Large customer model runs slowly with Multiple CPUs | @RISK |
| DTS-979 | Pressing the Esc-key while the mouse is down on window's title bar can cause VBA code execution to be interrupted | @RISK |
| DTS-1026 | Graphing Preferences Dialog BoxPlot tab has incorrect statistics names | @RISK |
| DTS-1063 | RiskLock doesn't return proper static value for Time Series functions | @RISK |
| DTS-1064 | Dragging and dropping between two Browse Result Windows can result in two curves showing the same output | @RISK |
| DTS-1065 | Copying and pasting sometimes works incorrectly inside the Define Correlation Dialog | @RISK |
| DTS-1067 | Linked fit that references a function name instead of a fit statistic fails | @RISK |
| DTS-1068 | Copying and pasting sometimes works incorrectly inside the Define Filters Dialog | @RISK |
| DTS-1069 | Copying and pasting sometimes works incorrectly inside the Scenario Settings Dialog | @RISK |
| DTS-1143 | Data Window display issues for large models | @RISK |
| DTS-1256 | Data Window's Iteration Step function crashes Excel with particular model | @RISK |
| DTS-1296 | Customer model cannot be Swapped in, message saying a formula couldn't be correctly parsed | @RISK |
| DTS-1305 | Improper license expiration messages from licenses borrowed from a network server | @RISK |
| DTS-1328 | Error message trying to edit a correlation matrix through Model Window | @RISK |
| DTS-1329 | Local help for some dialogs forced behind Excel window | @RISK |
| DTS-1360 | Iteration filter applied to statistic function causes crash if statistic functions update every iteration | DTools;@RISK |
| DTS-1083 | Diagnostic Utility is checking for incorrect VC++ runtimes | Installer / Deployment |
| DTS-1347 | Repairing a license doesn't refresh the Server Manager window | Licensing |
| DTS-349 | Training large customer file leads to 'Application-defined or object-defined error" | NeuralTools |
| DTS-531 | Right-click option to select or deselect all variables in the Data Viewer is not working | NeuralTools |
| DTS-993 | Right-click context menu shows also with left click in Dataset Manager Dialog | NeuralTools |
| DTS-536 | "Invalid formula" message trying to simulate PrecisionTree influence diagram in @RISK | PrecisionTree |
| DTS-786 | Influence Diagram calculation ordering problems | PrecisionTree |
| DTS-1362 | @RISK Reports sent to Excel do not include graphs when PrecisionTree is also open. | PrecisionTree |
| DTS-656 | Problems with Pareto Charts with large number of cateogories | StatTools |
| DTS-725 | Same variable can be selected as Cat and Val for Pareto Charts | StatTools |
| DTS-1071 | Inputs defined with RiskName don't display names correctly in tornado charts and spider graphs | TopRank |
Release 8.0.1 - July, 2020
Highlights
All Products: Dynamic Array Support
Some versions of Office 365 now include support for a new type of array formulas known as “dynamic arrays”. This resulted in changes to the syntax of some other non-array formulas: users will notice the “@” sign in some formulas, where it did not appear before. While TopRank itself does not make use of dynamic arrays, it has its own custom cell functions, and their syntax was affected by the introduction of dynamic arrays. This version has been made compatible with the new syntax.
PrecisionTree: Link to BigPicture Removed
The BigPicture add-in has been discontinued. The “View in BigPicture” ribbon command has been removed in this version.
TopRank: Running TopRank and @RISK at the Same Time
Previous versions of TopRank would sometimes require special reconfiguration of @RISK so the two add-ins could both be loaded at the same time. This requirement has been removed in this version.
Enhancements
| DTS-370 | Implemented ability to right-click on tornado bar to hide it | @RISK |
| DTS-409 | Minor formatting change in group separator rows in Detailed Statistics Report | @RISK |
| DTS-433 | Graph View of Correlation Definition Window displays coefficients for each cell | @RISK |
Fixes
| DTS-420 | Repair button improperly enabled for broken and expired licenses in Palisade Server Manager | Licensing |
| DTS-364 | Some permanent licenses incorrectly marked as expiring in Palisade Server Manager | Licensing |
| DTS-127 | Clicking on parameter label in Define Distribution Window leads to error | @RISK |
| DTS-191 | Right click on Category row in Results Summary window generates error message | @RISK |
| DTS-199 | Export to Excel from Data Window when Iterations is set to Auto generates 'Unable to generate report' error | @RISK |
| DTS-236 | Auto Save notification links to incorrect help page. | @RISK |
| DTS-242 | Graph font size problems with large monitors with large DPI scaling | @RISK |
| DTS-262 | Incorrect Filter Minimum and Maximum shown in Detailed Statistics Report | @RISK |
| DTS-263 | Sensitivity Report shows incorrect sensitivity calculation table in some situations | @RISK |
| DTS-264 | Compact Output report to Excel does not fit on one page | @RISK |
| DTS-265 | Incorrect Tornado bar labels for inputs containing RiskName property function that use cell references across multiple worksheets | @RISK |
| DTS-273 | Browse Results window too wide at 200% DPI scaling | @RISK |
| DTS-296 | Dragging graphs from Multivariate Data Viewer sometimes triggers error | @RISK |
| DTS-322 | Exports from the Data Window of very large data sets can generate 'Unable to copy cells.' error. | @RISK |
| DTS-347 | Knowlege Base item on the Resource menu links to incorrect web page | @RISK |
| DTS-438 | Deleted Predefined Distribution still shows on the Define Distribution Favorites list | @RISK |
| DTS-474 | File with copula information fails to open | @RISK |
| DTS-511 | Problems opening Define Correlation dialogs with inputs across multiple workbooks | @RISK |
| DTS-535 | Problem when two workbooks have correlation matrices with the same name | @RISK |
| DTS-621 | Bar Shading in Change in Output Tornado Graphs May Be Reversed | @RISK |
| DTS-623 | RiskName with multiple cells references for Alt distributions can cause errors | @RISK |
| DTS-624 | Compact output report delimiter values do not match Left X and Right X summary statistics values | @RISK |
| DTS-75 | Performing multiple exports from the Results Summary Window can cause Excel to close unexpectedly | @RISK |
| DTS-456 | Application Settings dropdown menu options can not be selected using mouse | TopRank |