Sensitivity Analysis Settings
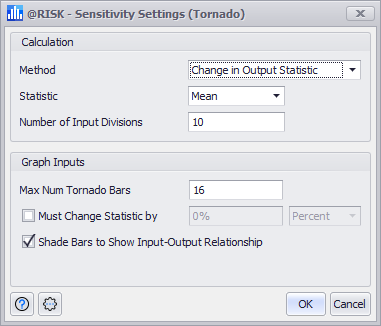
Figure 1 - Sensitivity Settings Window (Tornado Graph)
Every window, graph, or report that displays sensitivity information has a button to display the Sensitivity Analysis Settings window (Figure 1, right). This dialog controls which method of sensitivity analysis to perform, any additional options associated with that method, and (depending on the context) options that control how sensitivity graphs are to be displayed.
Overall, the options available are:
- Calculation - This option group contains configurations that control the sensitivity process.
- Graph Inputs - This option group contains configurations that control how sensitivity results will be displayed in graphs. The options displayed in this group change depending on the method chosen and also the context under which the dialog is being displayed.
-
- Max Num Tornado Bars - Available for all methods, Tornado graphs only. Limits the number of bars in a tornado graph to the specified value.
- Max Num Spider Lines - Available only for 'Change in Output Statistics' method, Spider graphs only. Limits the number of lines in the spider graph to the specified value.
- Must Change Statistic by - Available only for 'Change in Output Statistic' method, all graphs. Indicates a threshold that the output statistic must cross to be included in a graph. The value specified can be either a percentage change of the base-value of the output statistics (the value for that statistic for the whole simulation) or an actual value.
- Shade Bars to Show Input-Output Relationship - Available only for 'Change in Output Statistic' method, Tornado graphs only. Controls the shading of tornado graph bars on each side of the baseline. Shading indicates how the input associated with a bar changes in value when the output statistic increases or decreases.
-
For example, consider the 'Change in Output Statistic' tornado graph for an output Profit and two inputs, Revenue and Cost, in Figure 2 below.
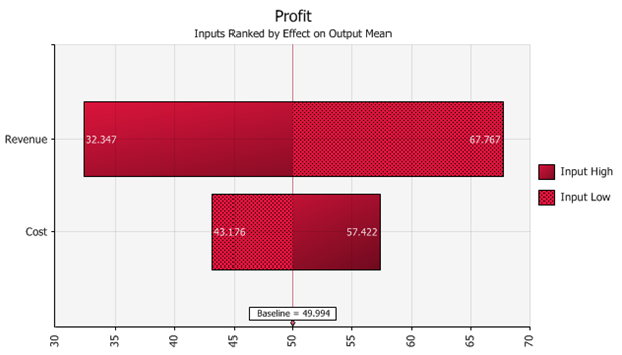
Figure 2 - Tornado Graph Shading Example
The darker section of the bar shows where input values are "low", and the brighter section where input values are "high". Thus, in the graph above, when the input Revenue is low, the mean for the output Profit is low. When Revenue is high, Profit is high. Conversely, when the input Cost is low, Profit is high and when Cost is high, Profit is low. Shading is only added by @RISK to tornado bars when the magnitude of the correlation coefficient between the input and output is at least .15. Tornado bars that do not meet the threshold will have no shading.
- Use Direction of Bar to Indicate Input-Output Relationship - Available only for 'Contribution to Variance' method, Tornado Graph only. Controls if contribution to variance bars use their direction to add information about the relationship between the input and output.
-
For example, consider the 'Contribution to Variance' tornado graph for an output - Profit - and two inputs, Revenue and Cost, in Figure 3 below. This graph does not have the 'Use Direction of Bar to Indicate Input Output Relationship' option enabled.
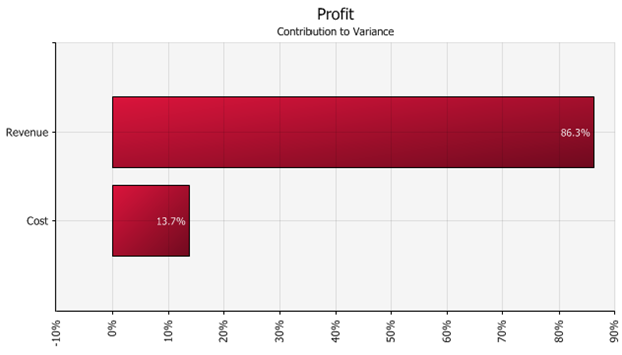
Figure 3 - Tornado Graph Example - No Direction
However, with the option selected, the extra information that the Cost has a negative impact on Profit is included in the graph, as demonstrated in Figure 4, below.
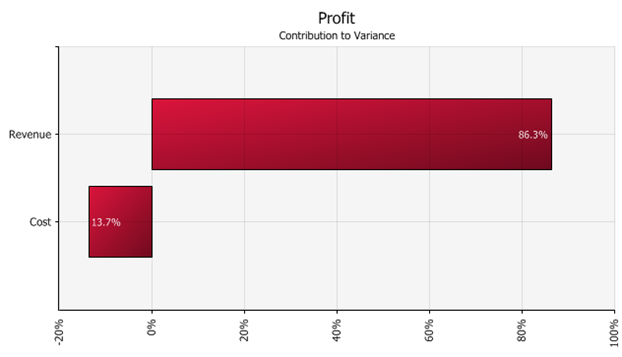
Figure 4 - Tornado Graph Example - Direction Enabled
Sensitivity Settings Command Buttons
The Sensitivity Setting window includes its own Settings/Actions command button with the following options: