Scenario Analysis Settings
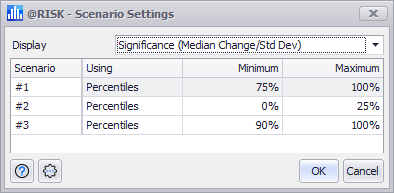
Figure 1 - Scenario Settings Window
Every window, graph, or report that displays scenario information has a command to display the Scenario Analysis Settings (Figure 1, right).
The Display pull-down menu controls what information is displayed about the significant inputs.
Please note: In the Scenario Analysis Window, this setting controls what information is displayed in the results table. In a tornado graph of scenario inputs, however, this setting indicates what additional information should be displayed on each tornado bar. The bar lengths themselves are always based on the input significance.
The Scenario Table allows the details of the output scenarios to be configured. They are specified in terms of either percentiles or values of the output. For example, if the desired scenario has the output in its upper 10th percentile, set the scenario to use percentiles, and set the Minimum and Maximum to 90% and 100% respectively. In contrast, a second scenario might have an output between the values of 100 and 200. In that case the scenario will use values, with the Minimum and Maximum values set to 100 and 200 respectively.
Scenario Settings Command Buttons
The Scenario Setting window includes its own Settings/Actions command button with the following options: