General Settings
The General tab of the Simulation Settings window contains the overall settings for a simulation run of the current model; this includes the number of iterations to use for each simulation that is executed, the number of simulations to execute in a single run, and what values to display in the Excel worksheet when a simulation is not running. Iterations and simulations work together to produce sample values for all distribution functions included in the model, potentially using different input parameters for each simulation.
When configuring a simulation run, it is important to note how the number of iterations and simulations work together, and the impact that those settings will have on the time it takes for a full simulation run to complete. In general, the more iterations being run during a simulation, the longer it will take for the simulation to complete; running multiple simulations during a single run will increase the overall run time, as each simulation will execute the configured number of iterations. For smaller models with fewer inputs, the difference in runtime may be negligible, but for large or complicated models with many inputs the impact of many iterations across several simulations can result in long-running simulations. See Iterations and Simulations for a more complete discussion of the implications of these settings.
Each of the Simulation Setting tabs have the same basic components, and they all share the same command buttons. The General Tab (Figure 1, below) is used as an example of a tab layout, but the concepts apply to all tabs.
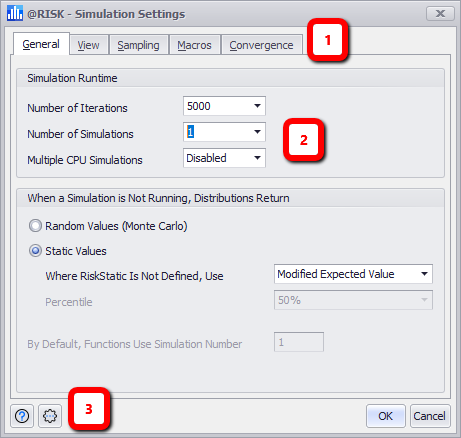
Figure 1 - Simulation Settings Window - General Tab
Simulation Settings Window
Each of the Simulation Settings tabs consist of the same basic components, which include
- Navigation Tabs
- Options Panel
- Command Buttons
The General tab contains two option groups:
At the very minimum, a simulation run needs to have the number of iterations and simulations set before it can be executed; @RISK has default settings, but these may not be appropriate for any given model. To set the basic configurations for a simulation:
There is a maximum number of iterations that can be run; however, it is highly recommended that the 'Automatic' setting for Iterations is used instead of setting this to a number greater than a few hundred thousand. A very high number of iterations not only results in long runtimes, but can cause other issues as well. See 'Automatic' Iterations for more information.
Simulation Runtime Options
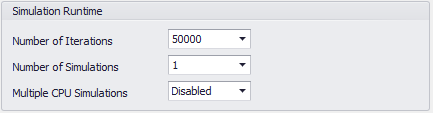
Figure 2 - Simulation Runtime Options
These options (Figure 2, right) control the most fundamental aspects of a simulation run - the number of iterations and how many simulations should execute during a single run. The options are:
Distributions Return Options
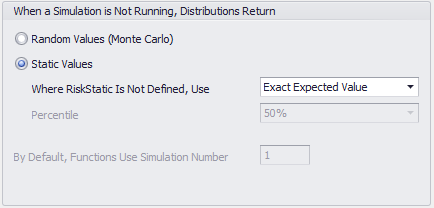
Figure 3 - Distributions Return Options
These options (Figure 3, right) control what is displayed in a worksheet when a simulation is not running; by default, @RISK Is configured to display static values in cells that contain distribution functions. However, the nature of the static value can be configured, or the workbook can be configured to show random values for each distribution function (as in, a sample value that would be returned by that distribution function).
These settings are particularly important when sharing an @RISK model! When sharing with other users who have @RISK installed, the value displayed can provide context without requiring those users to check the configuration of each input. When sharing with other users who do not have @RISK installed, the 'Distribution Returns' configuration will determine the value that is used to replace the @RISK function in each Input cell.
The options for displaying distribution function results are:
- Random Values (Monte Carlo) - Use a random sample value from the distribution function in each cell.
- Static Values - Use a static value, per the settings below.
- Where RiskStatic is Not Defined, Use:
-
-
The "expected value" of a distribution function is its mean; in instances where a probability distribution has no mean (e.g. Cauchy or Levy distributions), the expected value is the median.
- Modified Expected Value - Display the modified expected value in the cell; modified expected values are the expected value of the probability distribution rounded to the nearest integer.
- Exact Expected Value - Display the exact, unrounded expected value of the probability distribution.
-
The distinction between Modified and Exact Expected Values is only relevant when using discrete distributions; for continuous distributions both settings will display the same value.
- Mode - Display the mode of the probability distribution.
- Percentile - Display the selected percentile value of the probability distribution.
-
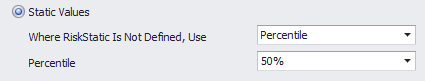
Figure 4 - Percentile Settings
When 'Percentile' is selected from the pull-down menu, the 'Percentile' field (Figure 4, right) will be made active; select a percentile value from the new pull-down menu, or enter a value manually.
-
- By Default, Functions Use Simulation Number - When a simulation run is configured to execute multiple simulations (using the 'Number of Simulations' setting, above), this field will be made active. Set this value to configure which simulation's version of the probability distribution will be displayed in the cell.