Distribution Artist
The Distribution Artist is a tool for creating free-form probability curves that @RISK will translate into a distribution function; these functions can then be used in a model just as any other @RISK input function. The Distribution Artist is a useful tool for analyzing probabilities and then creating distribution functions from their graphs; with the Distribution Artist it is possible to draw distributions as density functions, histograms, cumulative curves, or discrete distributions.
Within the Distribution Artist, a probability distribution consists of a series of X,Y coordinates on a graph area. The minimum and maximum values of the X-axis (represented by delimiters on the graph), as well as the number of coordinates used, are determined through the Distribution Artist Options. See below for more information.
To open the Distribution Artist window, click the Distribution button drop-down menu (the lower half of the button) and select 'Artist' (Figure 1, right). Depending on the contents of the currently selected cell, a different view of the Distribution Artist will open.
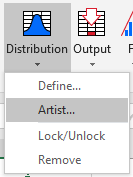
Figure 1 - Distribution Artist Menu
If the selected cell is empty the Distribution Artist Options window will open (Figure 2, below).
If the selected cell has a distribution function previously created with the Distribution Artist the main Distribution Artist window will open displaying the graph of the function. The probability can be edited from this window and written to a new cell; see Modifying Distributions.
If the selected cell has a distribution function that was created through another @RISK process (e.g. Define Distribution or Distribution Fitting), the Distribution Artist window will open displaying a graph of the selected distribution function. The probability can be edited from this window and written to a new cell; see Modifying Distributions.
Creating a Distribution
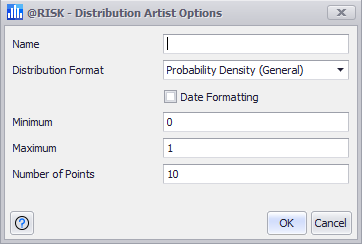
Figure 2 - Distribution Artist Options
When creating a new probability distribution through the Distribution Artist, the first window that will open is the Distribution Artist Options window. From this window the details of the new distribution can be configured, including:
Drawing a Graph
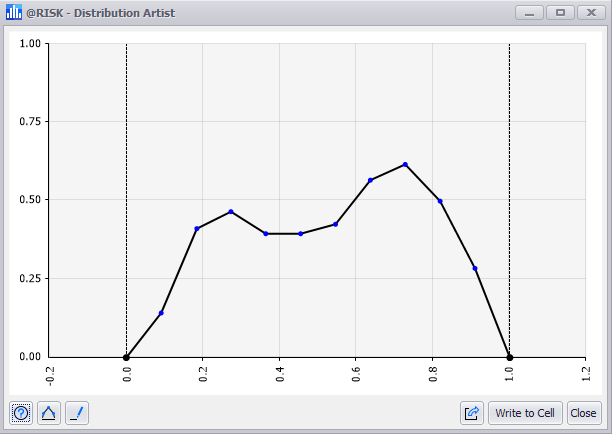
Figure 3 - Distribution Artist Graph
After the new distribution has been configured, the graph can be drawn on the graphing area of the Distribution Artist window (Figure 3, right).
To draw a graph, click and hold on the graphing area and drag to create a line; @RISK will display the line as it is drawn and once the mouse is released, the probability curve will be completed starting from the minimum value and ending at the maximum value. Once the curve has been drawn, it can be modified for fine tuning; see Modifying Distributions.
Once the distribution is finalized, click 'Write to Excel' to insert the resulting distribution function to an Excel worksheet. Other options for utilizing the distribution are available; see Distribution Artist Command Buttons for more information.